


The NICD reports 472 new COVID-19 cases that have been identified in South Africa, which brings the total number of laboratory-confirmed cases to 2,920,581. This increase represents a 1.4% positivity rate.As per the National Department of Health, a further 62 COVID-19 related deaths have been reported, bringing total fatalities to 89,049 to date.
18,440,973 tests have been conducted in both public and private sectors as per the table below.
| Sector | Total tested | New tested | ||
| PRIVATE | 9,938,202 | 54% | 18,017 | 55% |
| PUBLIC | 8,502,771 | 46% | 15,013 | 45% |
| Total | 18,440,973 | 33,030 |
PROVINCIAL BREAKDOWN
The majority of new cases today are from Gauteng (22%), followed by Western Cape accounting for 19%. KwaZulu-Natal accounted for 14%; Northern Cape accounted for 13%; Free State accounted for 9%; Eastern Cape, North West and Mpumalanga each accounted for 7% respectively; and Limpopo accounted for 3% of today’s new cases. The cumulative number of cases by province is shown in the table below:
| Province | Total cases for 26 Oct 2021 | Adjusted numbers after harmonisation | Updated total cases on 26 Oct 2021 | New cases on 27 Oct 2021 | Total cases for 27 Oct 2021 | Percentage total |
| Eastern Cape | 292,228 | 0 | 292,228 | 33 | 292,261 | 10.0 |
| Free State | 163,255 | 0 | 163,255 | 42 | 163,297 | 5.6 |
| Gauteng | 919,071 | -1 | 919,070 | 103 | 919,173 | 31.5 |
| KwaZulu-Natal | 515,318 | 0 | 515,318 | 68 | 515,386 | 17.6 |
| Limpopo | 122,200 | 1 | 122,201 | 12 | 122,213 | 4.2 |
| Mpumalanga | 151,838 | -2 | 151,836 | 32 | 151,868 | 5.2 |
| North West | 150,530 | 4 | 150,534 | 35 | 150,569 | 5.2 |
| Northern Cape | 92,304 | -2 | 92,302 | 59 | 92,361 | 3.2 |
| Western Cape | 513,365 | 0 | 513,365 | 88 | 513,453 | 17.6 |
| Unknown | 0 | 0 | 0 | 0 | 0 | 0.0 |
| Total | 2,920,109 | 0 | 2,920,109 | 472 | 2,920,581 | 100.0 |
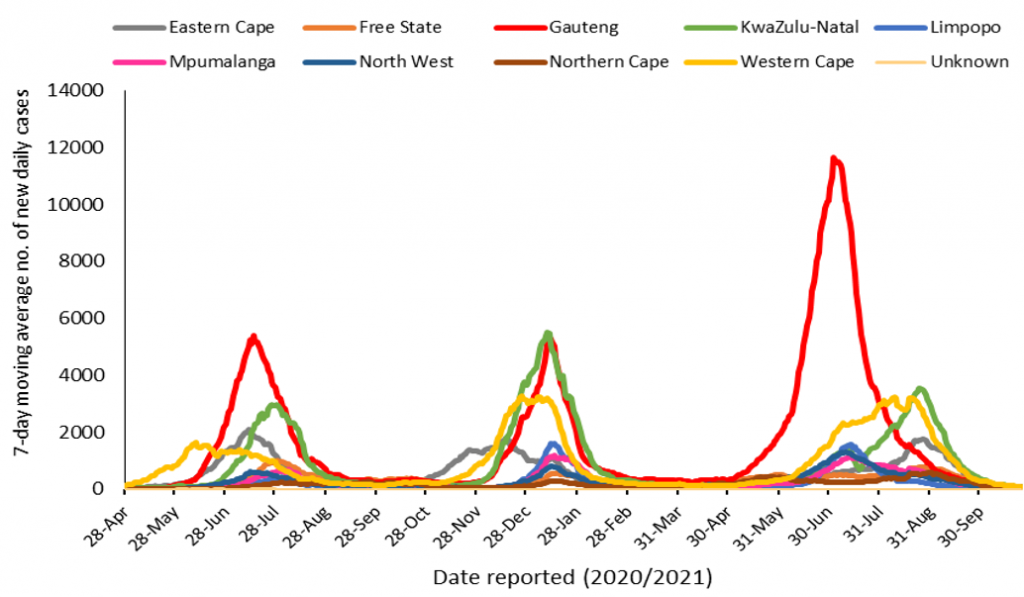
THE 7-DAY MOVING AVERAGE NUMBER OF NEW CASES BY PROVINCEThe total number of cases today (n=472) is higher than yesterday (n=331) and higher than the average number of cases per day over the 7 preceding days (n=391).
For more detailed information, visit the GIS Dashboard.
HOSPITAL ADMISSIONS
There has been an increase of 29 hospital admissions in the past 24 hours. The following table is a summary of reported COVID-19 admissions by sector.
| Sector | Facilities Reporting | Admissions to Date |
Died to Date | Currently Admitted |
| Private | 258 | 200,569 | 37,104 | 2,370 |
| Public | 408 | 233,678 | 56,955 | 1,623 |
| TOTAL | 666 | 434,247 | 94,059 | 3,993 |
VACCINE UPDATE
For updates on the national vaccine programme, click here.


0 comments:
Post a Comment