


The NICD reports 3,220 new COVID-19 cases that have been identified in South Africa, which brings the total number of laboratory-confirmed cases to 2,958,548. This increase represents a 9.2% positivity rate. As per the National Department of Health, a further 8 COVID-19 related deaths have been reported, bringing total fatalities to 89,791to date.
19,383,834 tests have been conducted in both public and private sectors as per the table below.
| Sector | Total tested | New tested | ||
| Private | 10,402,247 | 53.7% | 20,220 | 58.0% |
| Public | 8,981,587 | 46.3% | 14,660 | 42.0% |
| Total | 19,383,834 | 100.0% | 34,880 | 100.0% |
PROVINCIAL BREAKDOWN
The majority of new cases today are from Gauteng (82%), followed by North West and Western Cape each accounting for 4% respectively. KwaZulu-Natal and Mpumalanga each accounted for 3% respectively; Limpopo accounted for 2%; and Eastern Cape, Free State and Northern Cape each accounted for 1% respectively of today’s new cases. The cumulative number of cases by province is shown in the table below:
| Province | Total cases for 26 Nov 2021 | Adjusted numbers after harmonisation | Updated total cases on 26 Nov 2021 | New cases on 27 Nov 2021 | Total cases for 27 Nov 2021 | Percentage total |
| Eastern Cape | 293,122 | 0 | 293,122 | 21 | 293,143 | 9.9 |
| Free State | 165,446 | 0 | 165,446 | 35 | 165,481 | 5.6 |
| Gauteng | 936,862 | 11 | 936,873 | 2,629 | 939,502 | 31.8 |
| KwaZulu-Natal | 518,057 | 0 | 518,057 | 110 | 518,167 | 17.5 |
| Limpopo | 123,364 | -2 | 123,362 | 60 | 123,422 | 4.2 |
| Mpumalanga | 153,595 | 2 | 153,597 | 97 | 153,694 | 5.2 |
| North West | 153,839 | -11 | 153,828 | 116 | 153,944 | 5.2 |
| Northern Cape | 93,262 | 0 | 93,262 | 31 | 93,293 | 3.2 |
| Western Cape | 517,781 | 0 | 517,781 | 121 | 517,902 | 17.5 |
| Total | 2,955,328 | 0 | 2,955,328 | 3,220 | 2,958,548 | 100.0 |
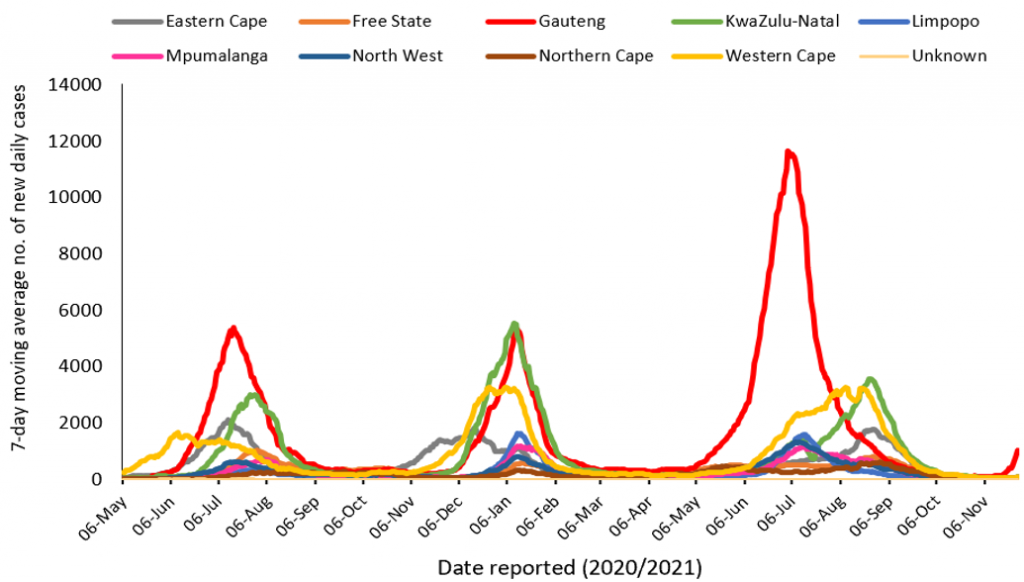
THE 7-DAY MOVING AVERAGE NUMBER OF NEW CASES BY PROVINCE
The proportion of positive new cases/total new tested today is 9.2% which is the same as yesterday (9.2%). The 7-day average is 5.2% today, which is higher than yesterday (4.3%).
For more detailed information, visit the GIS Dashboard.
HOSPITAL ADMISSIONS
There has been an increase of 30 hospital admissions in the past 24 hours. The following table is a summary of reported COVID-19 admissions by sector.
| Sector | Facilities Reporting | Admissions to Date |
Died to Date | Currently Admitted |
| Private | 258 | 201,016 | 37,354 | 1,241 |
| Public | 407 | 236,191 | 57,188 | 988 |
| TOTAL | 665 | 437,207 | 94,542 | 2,229 |
VACCINE UPDATE
For updates on the national vaccine programme, click here.


0 comments:
Post a Comment