


The NICD reports 11,125 new COVID-19 cases that have been identified in South Africa, which brings the total number of laboratory-confirmed cases to 3,031,694. This increase represents a 23.8% positivity rate.
As per the National Department of Health, a further 1 COVID-19 related deaths have been reported, bringing total fatalities to 89,966 to date.
19,761,834 tests have been conducted in both public and private sectors as per the table below.
| Sector | Total tested | New tested | ||
| Private | 10,630,898 | 53.8% | 35,052 | 56.8% |
| Public | 9,130,936 | 46.2% | 11,656 | 43.2% |
| Total | 19,761,834 | 100.0% | 46,708 | 100.0% |
PROVINCIAL BREAKDOWN
The majority of new cases today are from Gauteng (71%), followed by Western Cape (7%). KwaZulu-Natal accounted for 6% and North West accounted for 4%. Mpumalanga and Limpopo accounted for 3% and Free State and Eastern Cape each accounted for 2%. Northern Cape accounted for less than 1% of today’s new cases. The cumulative number of cases by province is shown in the table below:
| Province | Total cases for 04 December 2021 | Adjusted numbers after harmonisation | Updated total cases on 04 December 2021 | New cases on 05 December 2021 | Total cases for 05 December 2021 | Percentage total |
| Eastern Cape | 294,155 | -1 | 294,154 | 192 | 294,346 | 9.7 |
| Free State | 166,610 | 0 | 166,610 | 259 | 166,869 | 5.5 |
| Gauteng | 984,479 | 2 | 984,481 | 7,929 | 992,410 | 32.7 |
| KwaZulu-Natal | 521,599 | 0 | 521,599 | 687 | 522,286 | 17.2 |
| Limpopo | 125,537 | -1 | 125,536 | 372 | 125,908 | 4.2 |
| Mpumalanga | 156,205 | 0 | 156,205 | 389 | 156,594 | 5.2 |
| North West | 156,559 | 0 | 156,559 | 441 | 157,000 | 5.2 |
| Northern Cape | 93,654 | 0 | 93,654 | 49 | 93,703 | 3.1 |
| Western Cape | 521,771 | 0 | 521,771 | 807 | 522,578 | 17.2 |
| Total | 3,020,569 | 0 | 3,020,569 | 11,125 | 3,031,694 | 100.0 |
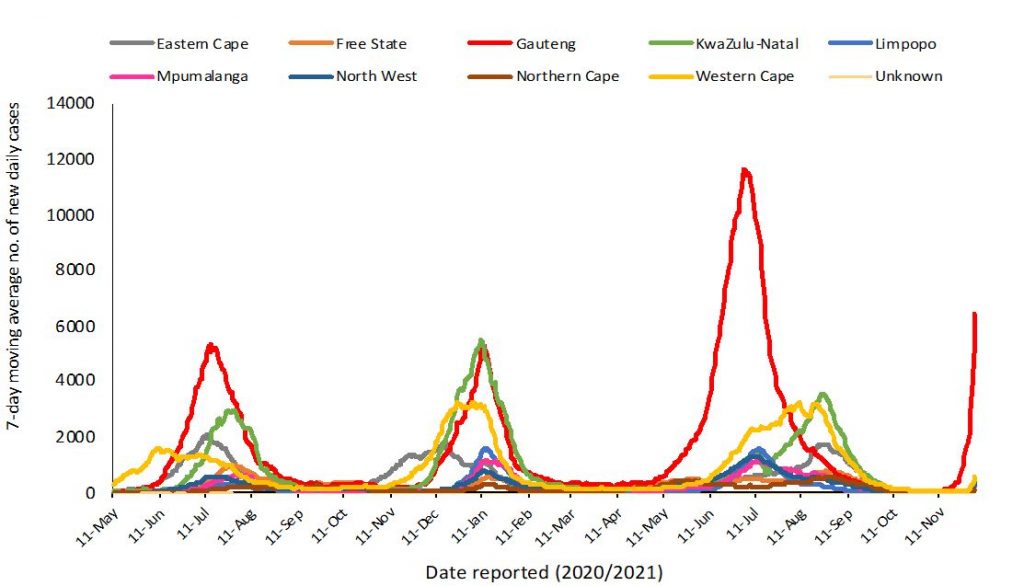
THE 7-DAY MOVING AVERAGE NUMBER OF NEW CASES BY PROVINCE
The proportion of positive new cases/total new tested today is 23.8% which is the same as yesterday (23.8%). The 7-day average is 18.8% today, which is higher than yesterday (16.8%).
For more detailed information, visit the GIS Dashboard.
HOSPITAL ADMISSIONS
There has been an increase of 28 hospital admissions in the past 24 hours. The following table is a summary of reported COVID-19 admissions by sector.
| Sector | Facilities Reporting | Admissions to Date |
Died to Date | Currently Admitted |
| Private | 258 | 202,211 | 37,402 | 1,638 |
| Public | 407 | 237,812 | 57,292 | 1,630 |
| TOTAL | 665 | 440,023 | 94,694 | 3,268 |
VACCINE UPDATE
For updates on the national vaccine programme, click here.


0 comments:
Post a Comment