


The NICD reports 11,535new COVID-19 cases that have been identified in South Africa, which brings the total number of laboratory-confirmed cases to 2,988,148. This increase represents a 22.4% positivity rate.
As per the National Department of Health, a further 44 COVID-19 related deaths have been reported, bringing total fatalities to 89,915 to date.
19,580,433 tests have been conducted in both public and private sectors as per the table below.
| Sector | Total tested | New tested | ||
| Private | 10,519,246 | 53.7% | 28,569 | 55.6% |
| Public | 9,061,187 | 46.3% | 22,833 | 44.4% |
| Total | 19,580,433 | 100.0% | 51,402 | 100.0% |
PROVINCIAL BREAKDOWN
The majority of new cases today are from Gauteng (72%), followed by Western Cape (6%). KwaZulu-Natal accounted for 5%. Limpopo, Mpumalanga and North West each accounted for 4% respectively; Free State and Eastern Cape each accounted for 2%. Northern Cape accounted for 1% of today’s new cases. The cumulative number of cases by province is shown in the table below:
| Province | Total cases for 01 December 2021 | Adjusted numbers after harmonisation | Updated total cases on 01 December 2021 | New cases on 02 December 2021 | Total cases for 02 December 2021 | Percentage total |
| Eastern Cape | 293,354 | -1 | 293,353 | 194 | 293,547 | 9.8 |
| Free State | 165,736 | 0 | 165,736 | 251 | 165,987 | 5.6 |
| Gauteng | 953,019 | 1 | 953,020 | 8,280 | 961,300 | 32.2 |
| KwaZulu-Natal | 519,067 | 0 | 519,067 | 630 | 519,697 | 17.4 |
| Limpopo | 123,983 | 0 | 123,983 | 421 | 124,404 | 4.2 |
| Mpumalanga | 154,349 | 0 | 154,349 | 454 | 154,803 | 5.2 |
| North West | 154,656 | 0 | 154,656 | 497 | 155,153 | 5.2 |
| Northern Cape | 93,379 | 0 | 93,379 | 81 | 93,460 | 3.1 |
| Western Cape | 519,070 | 0 | 519,070 | 727 | 519,797 | 17.4 |
| Total | 2,976,613 | 0 | 2,976,613 | 11,535 | 2,988,148 | 100.0 |
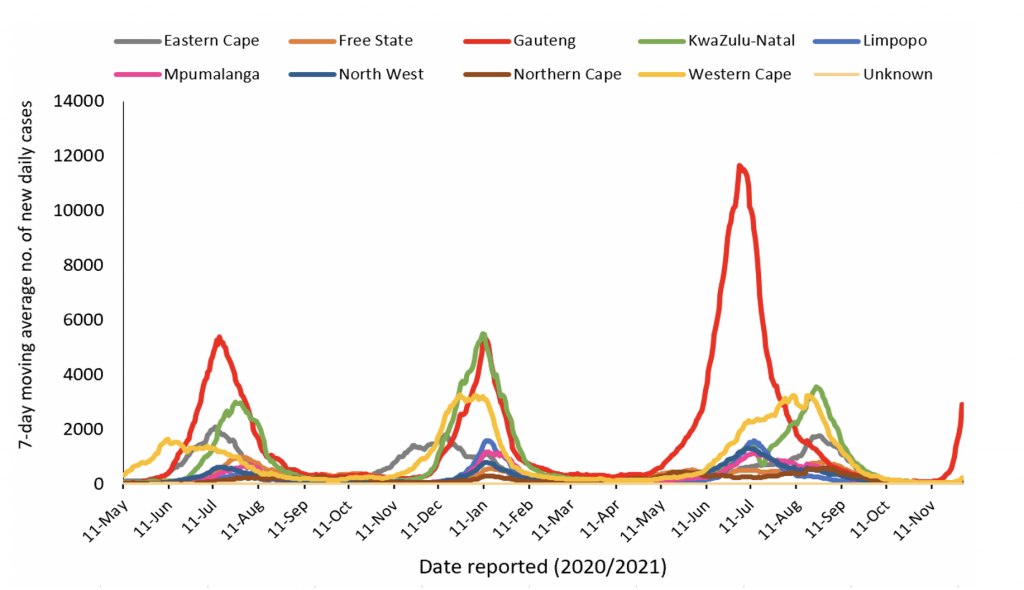
THE 7-DAY MOVING AVERAGE NUMBER OF NEW CASES BY PROVINCE
The proportion of positive new cases/total new tested today is 22.4% which is higher than yesterday (16.5%). The 7-day average is 12.6% today, which is higher than yesterday (10.3%).
For more detailed information, visit the GIS Dashboard.
HOSPITAL ADMISSIONS
There has been an increase of 274 hospital admissions in the past 24 hours. The following table is a summary of reported COVID-19 admissions by sector.
| Sector | Facilities Reporting | Admissions to Date |
Died to Date | Currently Admitted |
| Private | 258 | 201,784 | 37,397 | 1,484 |
| Public | 407 | 237,341 | 57,269 | 1,420 |
| TOTAL | 665 | 439,125 | 94,666 | 2,904 |
VACCINE UPDATE
For updates on the national vaccine programme, click here.


0 comments:
Post a Comment